Reports gather data from tasks, time tracking and CRM into ready-made tables and charts. Reports only show data — you can't change anything through them.
Where to find
Sidebar → Reports. The page shows cards for the reports available to you: click a card to open a report. The ← Reports link above the title takes you back to the list.
Schedule Plan vs Fact
A timeline showing how tasks were planned and how they actually went.
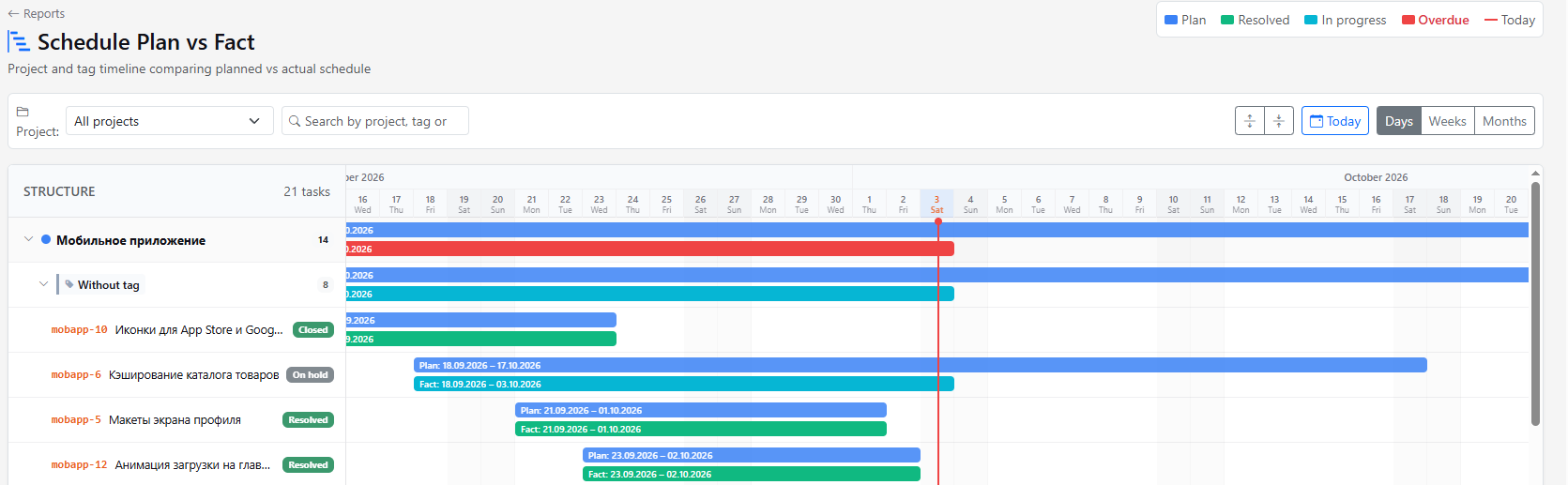
- On the left is the Structure: projects, tags inside them, and tasks inside tags. Tasks without a tag are grouped under Without tag.
- Each task has two bars. The top, blue one is the Plan: from the task's start date (or creation date) to its deadline. The bottom one is the Fact: from the first to the last work entry; if there is no work logged, an unfinished task's fact runs until today.
- The bottom bar's color: green — Resolved, light blue — In progress, red — Overdue (the task isn't resolved and the deadline has passed). The red vertical line is Today.
How to use it
- In the Project field, pick a project or leave All projects.
- To find something, start typing a project, tag or task name in the search field.
- Pick a scale: Days, Weeks or Months. The Today button scrolls the timeline to today.
- The arrow buttons collapse and expand all groups at once.
- Hover over a bar to see a tooltip with the status, assignee, time spent and progress. The task number opens the task in a new tab.
Only tasks with dates appear in the report. To see the plan, give tasks a deadline.
By people
A feed of people's actions in tasks: who created what, who reassigned to whom, which statuses changed, what was commented. Handy for seeing what someone worked on during a day or a week.
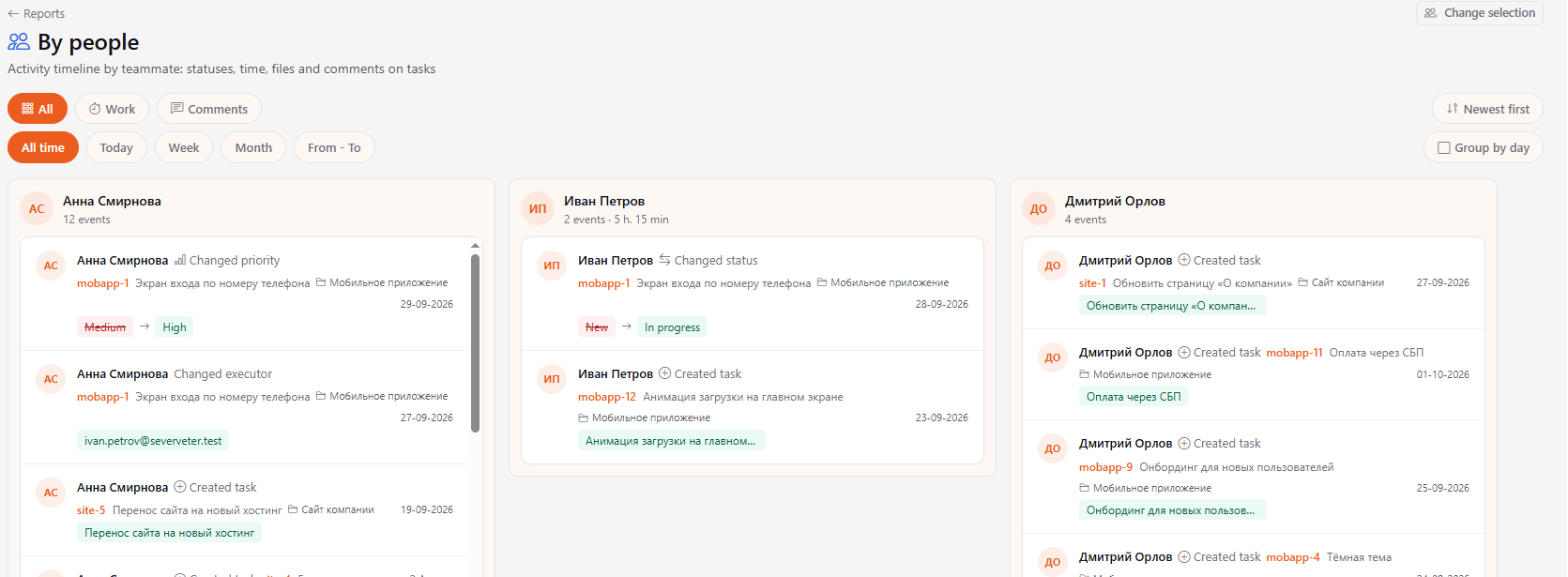
- In Pick up to 3 people, check one to three people and click Show.
- Each person gets a column. Its header shows the number of events and, if the person logged work, the time worked.
- Filter events: All, Work or Comments.
- Pick a period: All time, Today, Week, Month or From - To for your own dates. A week starts on Monday, a month on the 1st.
- The Newest first button reverses the order, and the Group by day checkbox splits the feed by date.
To pick other people, click Change selection. At the bottom of a long column there's a Load more button.
Clients — Details & Billing
A table of billing details and contract data for all clients: country, address, tax number, contract number and date, currency, services, bank, email and phone. The data comes from the Billing tab of the client card — see Clients.
- Filter clients by the Type field.
- Click a column header to sort the table.
- Export CSV downloads the table as a file that opens in Excel.
Tasks by people
How many hours each person spent on each task over a period — with Excel export. Hours are counted by the date the work was logged for.
- Pick people in the Add a person... field.
- Pick a period: Month or From - To.
- Click Generate — each person gets a list of tasks with hours and a Total row.
- Export to Excel downloads the same report as a file.
This report isn't available to everyone: only people with personal access can see it. If it's not in your list and you need it, contact your administrator.